![]()
User Guide for ProjectSheet for Excel add-in
Contents
Resource columns (in Pro only)
FAQ - Frequently Asked Questions
Tutorial videos
Quick tour of Free add-in [2:56]
Quick tour of Pro add-in [3:51]
Spreadsheet add-in
In Microsoft Excel you can install from the Add-ins store that can be found in the Home ribbon. Enter "projectsheet" in the search box and Add the add-in, as shown in the Install add-in video.
You can also install from the Microsoft AppSource.
After installation the Home ribbon gets a ProjectSheet button to open the Taskpane.
Worksheets
The Taskpane of the ProjectSheet add-in opens with the Open Taskpane button in the Home ribbon. It appears on the right side of the spreadsheet.
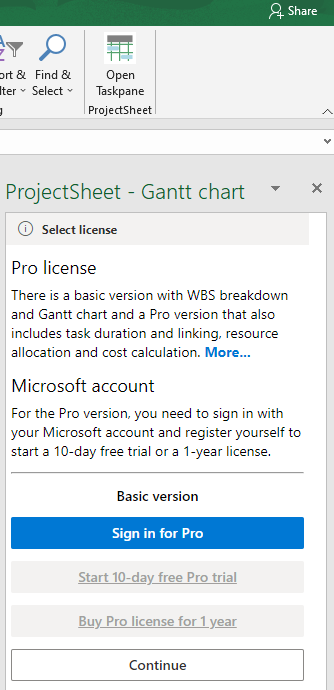
You can Continue with the Free version or Sign in for Pro using Single Sign On (SSO) with your Microsoft account. Then you can start a 10-days trial by filling in a registration form. During or after the trial you can buy a Pro license.
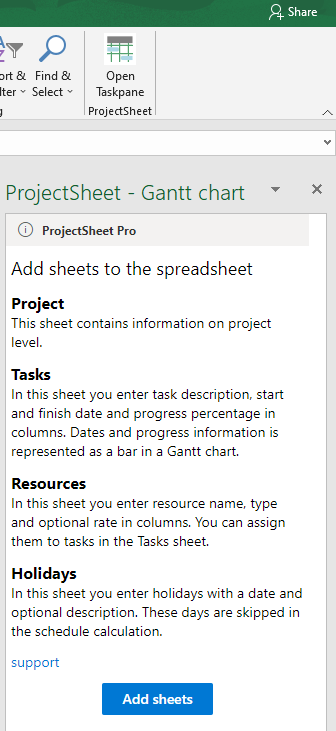
When opened for the first time, the Free version adds two worksheets: Project and Tasks,
the Pro version adds four worksheets: Project, Tasks, Resources and Holidays.
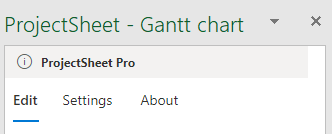
The Taskpane will be replaced with three tabs, one to Edit, one for Settings and one with information About the add-in. You can close the Taskpane and continue with editing.
Project schedule
You can edit the spreadsheet directly or via the add-in Taskpane. Some cells can be edited both ways, but the Taskpane always has the right formatting. The Taskpane corresponds to the selected task row in the spreadsheet.
Cell changes in the ProjectSheet columns are processed by the add-in, resulting in changes in the spreadsheet and Taskpane. The meaning of the columns is described here. Own columns are not processed by ProjectSheet and can contain text, dates, etc. or cell-formulas that refer to ProjectSheet columns.
Edits on entire task rows, like delete, move or copy/paste are processed by the add-in as well. You select a task row on the left side of the spreadsheet. Be aware that that the WBS level may change because you delete a summary task or the source and destination rows are on different levels.
Framework and Layout
The ProjectSheet add-in uses spreadsheet elements like sheets, columns, rows and cells, to create a framework with tasks, resources, Gantt chart, etc. The framework should not be changed because the add-in relies on it.
The layout can be changed, like colors, fonts, etc. You can apply spreadsheet functions, like filtering columns. Sorting selected rows is also possible, but only use it on tasks with the same summary task. Cell formulas can be used in Own columns and in ProjectSheet columns with some restrictions, see the example.
This is a table of what you can and CANNOT change:
| do NOT | do |
| change the framework | change the layout |
| change the Gantt chart in the sheet itself | adjust the Gantt timescale in the Taskpane |
| delete or copy ProjectSheet columns | hide ProjectSheet columns |
| protect sheets and ranges against editing | share spreadsheet for viewing |
| insert rows that do not have task columns | insert Own columns left of the Gantt chart |
| delete header rows | change the order of columns |
| change hidden header row 3 | change the text of headers |
| delete or copy ProjectSheet worksheets | add Own worksheets |
Gantt chart
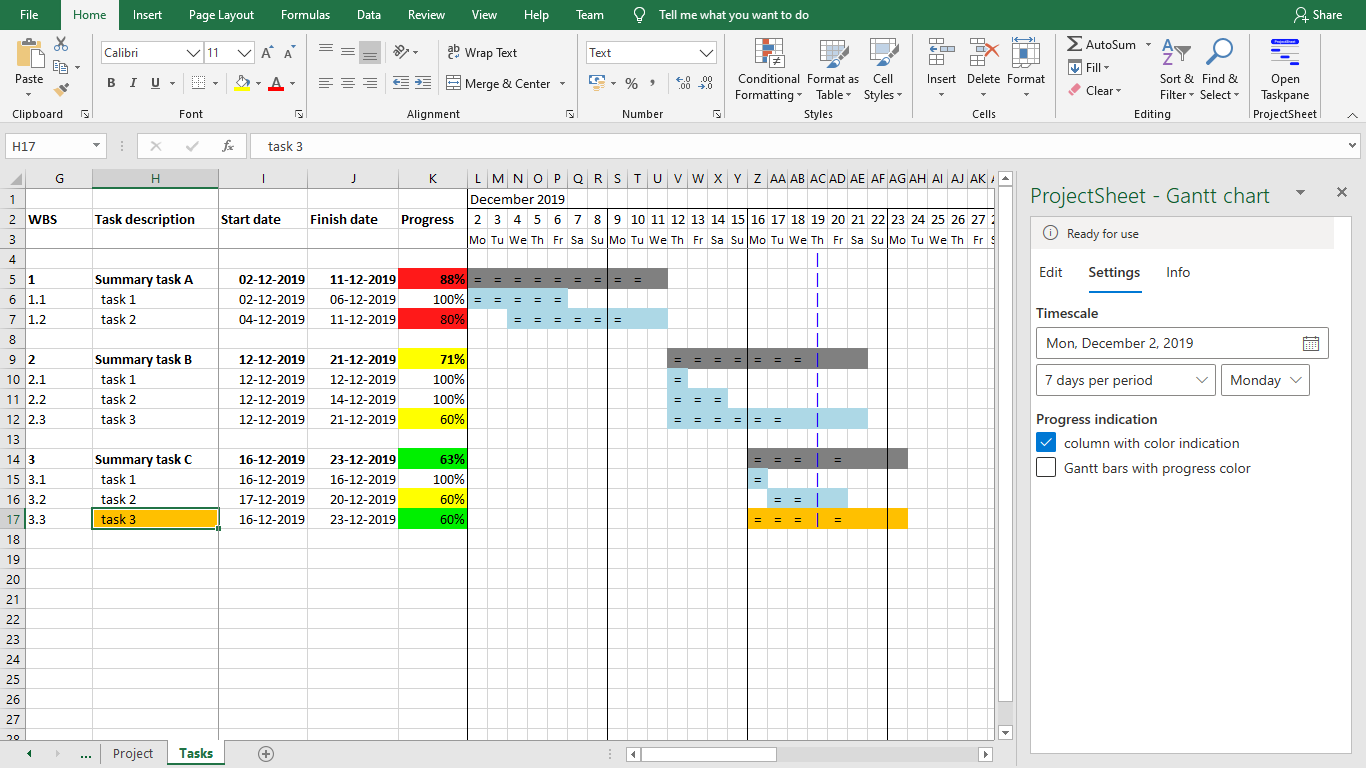
The Tasks worksheet is shown in the screenshot below and consists on the left side of a table with the schedule and on the right side of a generated Gantt chart. On the far right is the add-in's Taskpane. When edits are made in the spreadsheet or Taskpane, the schedule and Gantt chart are updated during the wait period, indicated with the wait color at the top of the Taskpane.
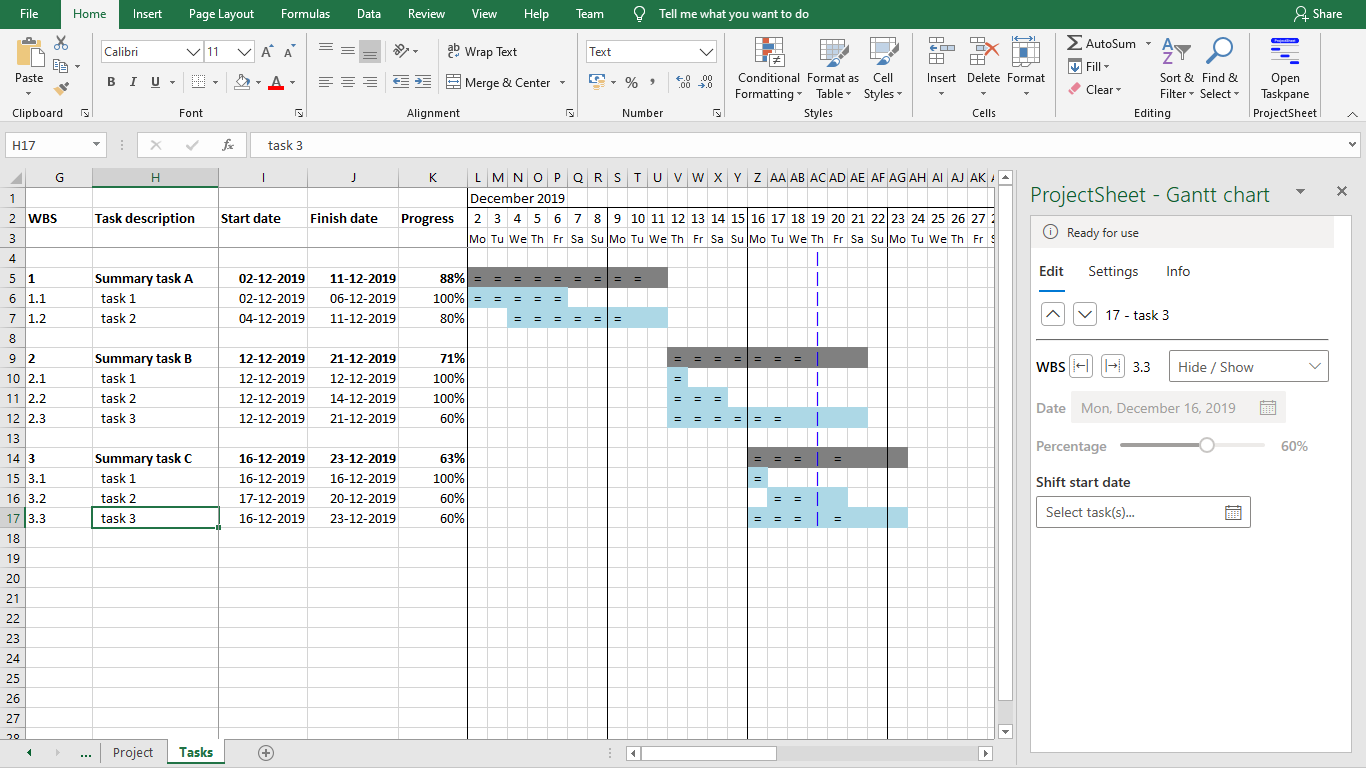
The Start and Finish dates correspond to bars in the Gantt chart. The WBS code indicates how the tasks are structured with summary tasks.
The start date of the summary task equals the earliest start date of its subtask(s), the finish date of the summary task equals the latest finish date of its subtask(s).
The Progress percentage corresponds to a double line in a bar.
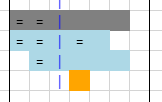
The date of today is shown with a vertical dashed blue line in the Gantt chart.
A task is blue, a summary task is gray and a milestone is orange.
When present, the background color of the Task description is shown as the color of the bar.
If you change the color, click the Refresh button to update it.
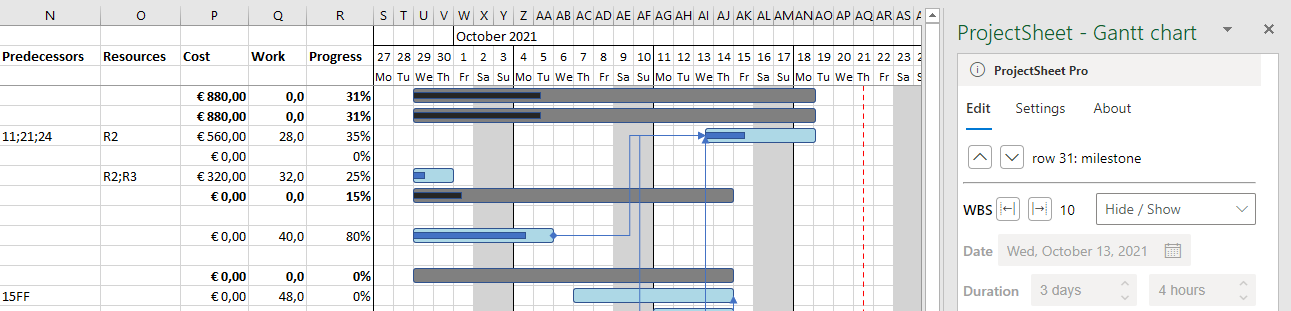
The Pro version shows a link between tasks in the Gantt chart with an arrow and progress with a solid bar inside the Gantt bar.
Timescale
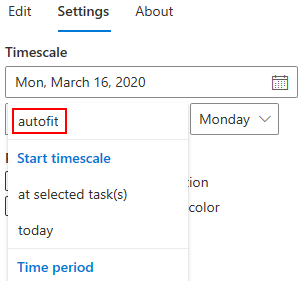
The Gantt chart shows the entire schedule or a part of it, depending on the timescale set in the Settings tab in the Taskpane. You can set the Start date of the timescale to scroll through the Gantt chart. The Start date can be set with the date picker or to today or to the earliest start date if the selected tasks. You can set the Time period of the timescale to see the entire project in the Gantt chart (in Pro only). The Time period starts with 1 day per cell and ends with 3 years for the entire timescale (18 days per cell). Both Start date and Time period are set automatically with Autofit (in Pro only).
You can set the start day of the week in the Gantt, default is Monday.
Task columns and Taskpane
You find the Task columns in the Tasks worksheet. The Taskpane is located to the right of the spreadsheet. Columns can be modified directly in the cell and/or via the Taskpane.
WBS and Task description
In the Task description column you start entering the schedule. The WBS column is calculated and shows a code indicating the Work Breakdown Structure of the tasks. When present, the Task description background color is shown as the color of the Gantt bar after clicking the Refresh button. Deleting the task description text will remove the entire task.

These up/down buttons in the Taskpane move to the previous/next task row.
The spreadsheet row index is shown behind the buttons, followed by the WBS code and task description.
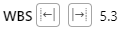
These buttons in the Taskpane decrease/increase the WBS level of the selected task row(s).
The WBS hierarchy is also shown in the indention of the Task description text.
So-called summary tasks are in bold text.
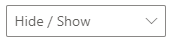
This dropdown in the Taskpane has functions to collapse/expand selected or all summary tasks
to get an overview of the schedule.
- collapse level - Collapse all summary tasks with the same indent level as the selected summary task
- hide 100% completed - Hide all (summary) tasks that have 100% progress

This button inserts a summary task above the selected tasks.
You can modify the summary task description afterwards.
This function is a quick and straight-forward alternative for inserting an empty row,
adding a summary task description and selecting the sub-tasks for indenting.
Duration (Pro only)
The duration of a task is the time between Start and Finish date. When changed, the Finish date is recalculated, while the Start date is kept. When the Finish date is changed, the Duration is changed while the Start date is kept. A task becomes a milestone if it has a duration of 0.
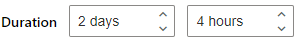
The Days and Hours spinners in the Taskpane set the duration in the selected cell(s) in the spreadsheet.
Start and Finish dates
The Start column contains the start date of a task, the Finish column the finish date. The summary dates and Gantt chart are calculated when applicable. For the Free version a task becomes a milestone if it only has a finish date.
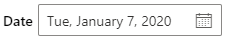
The date picker in the Taskpane puts the picked date in the selected cell(s) in the spreadsheet.
Predecessors (Pro only)
You can enter a predecessor task by entering its spreadsheet row number. Multiple tasks as a predecessor are separated with a semicolon: 12;24. The type of link and lag/lead can be added to the link: 11FF+2d.
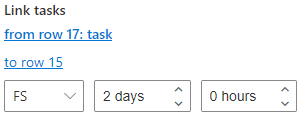
You can also link tasks by selecting tasks in the spreadsheet and using Link tasks in the Taskpane.
First click on a task in the spreadsheet and then on from in the Taskpane.
This task will go from italic to bold in the Taskpane.
Then click on a task and on to to create a link.
After creating a link you can change the link type and lag/lead time with days and hours. You can repeat this for more to tasks. Clicking on to again will unlink. You can also create links in reverse with to and one or more from tasks.
Condition (Pro only)
The Condition column shows additional conditions for tasks on how the planning should be scheduled. The rows have a pull-down menu with four options when the cell is selected:
- ASAP - As Soon As Possible (default)
- ALAP - As Late As Possible
- start on - On this date or later
- finish on - On this date or earlier
No text in the cell means ASAP.
Resources (Pro only)
The Resources column shows the assigned resources from the Resources worksheet. The resource corresponds to the name or abbreviation if present. Multiple assigned resources are separated with a semicolon. The default assigned quantity is 1, between square brackets a different quantity can be entered. Example of resource assignment: A;B[0.5]
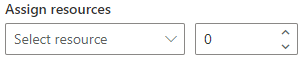
The resources in the Resources worksheet are also present in a dropdown menu in the Taskpane.
Click on a task and select a resource from the dropdown menu.
Already assigned resources are in bold.
The default assigned quantity for a new resource is 1.
You can enter a different quantity for an already assigned resource with the spinner.
A quantity of 0 will remove the resource from the task.
Work (Pro only)
The amount of work hours per task or summary task.
Cost (Pro only)
Total cost per task or summary task for all assigned resources. The cost calculation depends on the resource Rate and Type. When no resources are assigned, you can enter costs yourself.
Progress percentage
The progress percentage of each task. Summary task progress is calculated from its subtasks. Entering the percentage for one or more cells at once can be done in the Taskpane:

This slider puts the chosen progress percentage in the selected cell(s) in the spreadsheet.
Shift start date
This function allows you to shift the start and finish dates of the selected row(s).
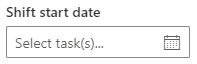
The date picker will show the earliest start date in the selected rows.
When you change this date, all selected start and finish dates will shift accordingly.
Resource columns (Pro only)
You find the Resource columns in the Resources worksheet.
Resource name
Entering a name will add the resource, removing the name will remove the resource. A resource can be assigned to one or more tasks. Assigning a new resource to a task will be added to the Resources worksheet.
Changing the name of a resource in the Resources worksheet will also be changed in all assignments in the Tasks worksheet. Removing a resource in the Resources worksheet will also be removed from all assignments in the Tasks worksheet.
Abbreviation
The abbreviation replaces the resource name in the Resources column in the Tasks worksheet for convenience.
Type
The types are in a pull-down menu when you select the cell:
- work - Resources per task work hour, like labor
- equipment - Resources per task duration hour, like rented equipment, etc.
- material - Resources per unit, like parts, building material, etc.
Rate
Tariff per hour for Work and Equipment type resource and cost per unit for Material type resource.
Count
Total hours for Work and Equipment type resource and total quantity for Material type resource across all tasks.
Cost
Total cost per resource across all tasks.
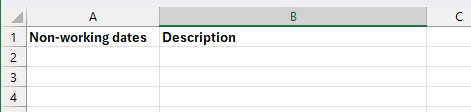
Holidays (Pro only)
Non-working holiday dates can be entered in the Holidays worksheet. Each date is on a separate row; the description is optional. The dates can be entered using the datepicker in the Taskpane. You can use the handle at the bottom right corner of a cell to fill rows with subsequent dates.
Settings tab
You find this tab in the Taskpane. The Taskpane is located to the right of the spreadsheet.
Timescale
The timescale of the Gantt chart is explained here.
Progress indication
The progress indication can be set for the Progress column and Gantt chart independently.
The colors have the following meaning:
| Condition | Color |
| today before task start date | no color |
| today after task start date and progress on schedule | green |
| today after task start date and progress behind schedule | yellow |
| today after finish date and progress less than 100% | red |
| progress equals 100% | no color |
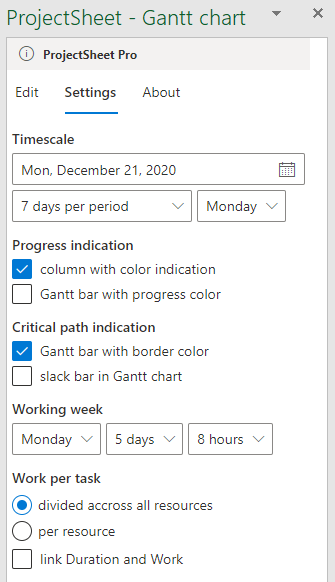
Critical path indication (Pro only)
Linked tasks which are on the critical path will cause project delay when they are delayed. Non-critical tasks have slack time before they cause project delay. Options for critical path visibility in the Gantt chart:
- Tasks on the critical path get a red border.
- Non-critical tasks will have their slack time visible with a dotted bar.
Working week (Pro only)
Set the working week by selecting
- Start day of the working week
- Number of consecutive working days per week
- Working hours per day
The non-working days (weekends) are gray columns in Gantt charts that have a scale of 1 day per column.
Work per task (Pro only)
You can assign the work hours of a task among the resources or per resource.
- Dividing the work hours over the resources is desirable if the resources do the same work. More resources means that the work hours are divided over the resources, depending on the assigned quantity.
- If the resources assigned to a task do different work, it is desirable to assign the work hours to each resource individually. With the assigned quantity it is then possible to vary the work hours per resource.
Task duration and Work hours can be set independent or follow each other with the set working hours per day.
Cell formulas example
The Duration and Work columns in the Pro version can also contain cell formulas. As long as they are not overwritten by ProjectSheet, they will remain. The formulas can calculate the duration or work based on one or more parameters from inserted columns. To calculate the resulting schedule, you need to click on the Refresh button in the Taskpane.
As a setting, Duration and Work can be linked. The duration is then calculated from the work and assigned resources. Cell formulas in the Duration column are likely to be overwritten and removed by the value in the Work column. In this case it is advised to use cell formulas in the Work column only, not in the Duration column.
FAQ - Frequently Asked Questions
How to expand the timescale of the Gantt chart?
Do not change the Gantt chart in the spreadsheet itself. Change the Start date and Time period (in Pro only) of the chart in the Settings tab of the Taskpane. By changing the Start date you can scroll through the Gantt chart.
Why are the dates in the Gantt scale 4 years and 1 day earlier than the dates in the Start and Finish cells?
Excel has two date systems, Windows always uses the 1900 system, Mac also uses the 1904 system. ProjectSheet for Excel uses the 1900 system. Here you can read how to switch from the 1904 date system to the 1900 date system in Excel, depending on your Excel version: Date systems in Excel.
How to solve "Add-in Error. We couldn't connect to the 'Office Store' catalog server for this add-on"?
If your company supplies Microsoft Office 365 to you, you can check with the administrator if ProjectSheet - Gantt chart can be added in the Admin Center from the Office Store (Settings > Integrated apps).
Why are the Gantt bars sometimes not aligned with the tasks in the Pro version?
This may happen when the spreadsheet zoom level is not 100%, as a result of an issue in the Microsoft framework. As a workaround there is the Gantt Free version option at the bottom of the Taskpane on the right.
What is the minimum requirement for this Excel add-in?
The Microsoft AppSource store states Excel 2019, the minimum Excel version required is the 1808 (2018, August) update. You can find your version under Account > About Excel.
Can I transfer my account license to another account when I leave the company?
Yes, you can do this once free of charge by starting a ProjectSheet for Excel trial on your new Microsoft account. The license expiry date of the deprecated account is then transferred to the new account. Send a request for transfer to the Helpdesk in which you mention the deprecated and new account.
Can I convert my account license to a domain license?
Yes, you can do this by buying a domain license for your domain. The remaining time of the account license divided by 5 is then added to the expiry date of the domain license. The factor of 5 is the price difference between account and domain licenses. Send a request for conversion to the Helpdesk in which you mention the domain.
How to remove the add-in?
Find the ProjectSheet add-in in the Insert ribbon under Office Add-ins in the MY ADD-INS tab.
Click on the three dots for the menu and choose remove.
If ProjectSheet is not there, you can look in the ADMIN MANAGED tab and ask the administrator.
Make sure that you remove the add-in from all the desktop Excel apps that you used on all your devices
and also from Office online, to prevent a taskpane with a Trust this add-in button when you open the spreadsheet again.