
ProjectSheet for Excel
Project Planning in spreadsheet
Plan and Track your Project with WBS breakdown and Gantt chart
Planning and Tracking helps the project team to remain focused and motivated. With planning you create an overview of all goals and how to achieve them. A Work Breakdown Structure (WBS) gives you a total overview with layered details. You estimate the amount of work and the tasks are scheduled in time. A Gantt chart makes the schedule visible as bars. Progress is indicated in the bars.
For flexibility you can create the WBS, schedule and Gantt chart in a spreadsheet, but this may be time consuming and prone to errors, especially when you need to update the schedule. With the ProjectSheet add-in you create and maintain a WBS and schedule faster and more accurately in Excel than by hand or by using a template with cell formulas. The add-in assists on data you enter in the worksheet or by applying the functions in the Taskpane on the right side of the worksheet. Spreadsheet functions like filtering can still be used.
At first, the Free add-in inserts a worksheet with columns for the tasks, WBS code and time schedule. The Gantt chart is integrated in the worksheet per task row. The Pro version also inserts a worksheet with resources that can be assigned to tasks. Since each company and project is different, you can insert your own custom columns with data or cell-formulas that refer to the add-in's columns.
The add-in can be inserted in Excel online in a web browser and in Excel on a Windows or Mac PC.
Excel online is available as free Microsoft 365 with apps and a limited storage of 5 gigabyte.
Install from Microsoft AppSource

LinkedIn:
Demo videos
Quick tour of Free add-in [2:56]
Quick tour of Pro add-in [3:51]
Work Breakdown Structure
The tasks are put in a hierarchical WBS by indenting them using the Taskpane. They get a WBS code accordingly. Summary tasks can be collapsed/expanded for a better overview. Summary tasks in the WBS receive start and finish dates from their sub-tasks.
Project schedule in Gantt chart
The dates for starting and finishing a task are entered in the spreadsheet or using a date picker in the Taskpane.
The time between start and finish dates appear as a bar in the Gantt chart. The start date of the Gantt timescale can be changed to scroll through the project in detail. In the Pro version, the time span of the Gantt timescale can be changed to view the entire project.
Progress tracking with Colors
During project execution you enter progress as a percentage to each task. The percentage can be entered in the spreadsheet but also with a slider in the Taskpane. 100% completed tasks can be filtered out. Progress of summary tasks are calculated from their sub tasks. Optional colors in the schedule table or Gantt chart indicate progress and delay.
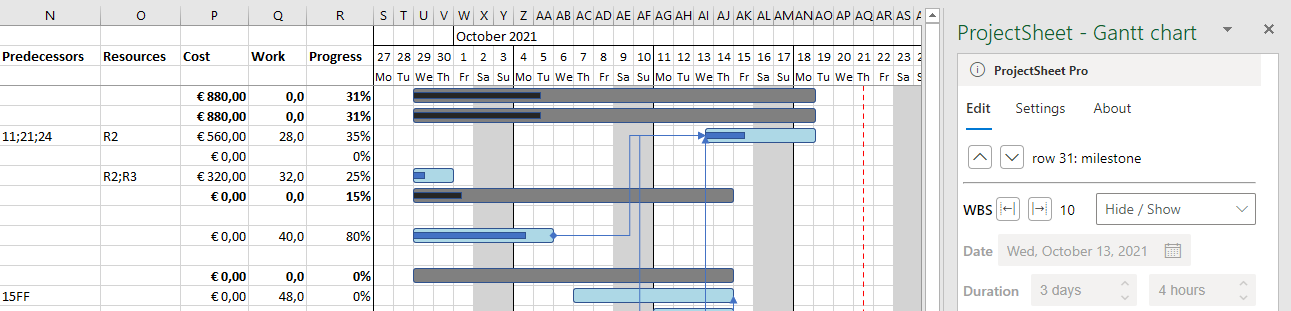
Pro version with Critical path method, Resource assignment and Cost calculation
The Pro version includes critical path scheduling based on task duration and task dependencies, taking working hours and non-working holidays into account.
Resources are kept in a separate worksheet and can be assigned to tasks. A resource can be work or material. Work resources can use the work per task to calculate the duration. Costs per task and resource are calculated based on resource rate and work hours.
After sign-in with your Microsoft account and in-app registration, the Pro license per account is available for €24 / year using PayPal without automated extension, so no direct debit every year. The price per domain including all accounts is €120 / year. You can try the Pro version for 10 days for free without any obligation.